New Method of Modeling Market Regimes Using Efficient Frontier Information
Published 28 November, 2023
Financial markets often undergo changing regimes or states, where environments can be significantly different from one another. Various models have attempted to capture the dynamics of these regimes, but exhibit poor performance when tested on unfamiliar data.
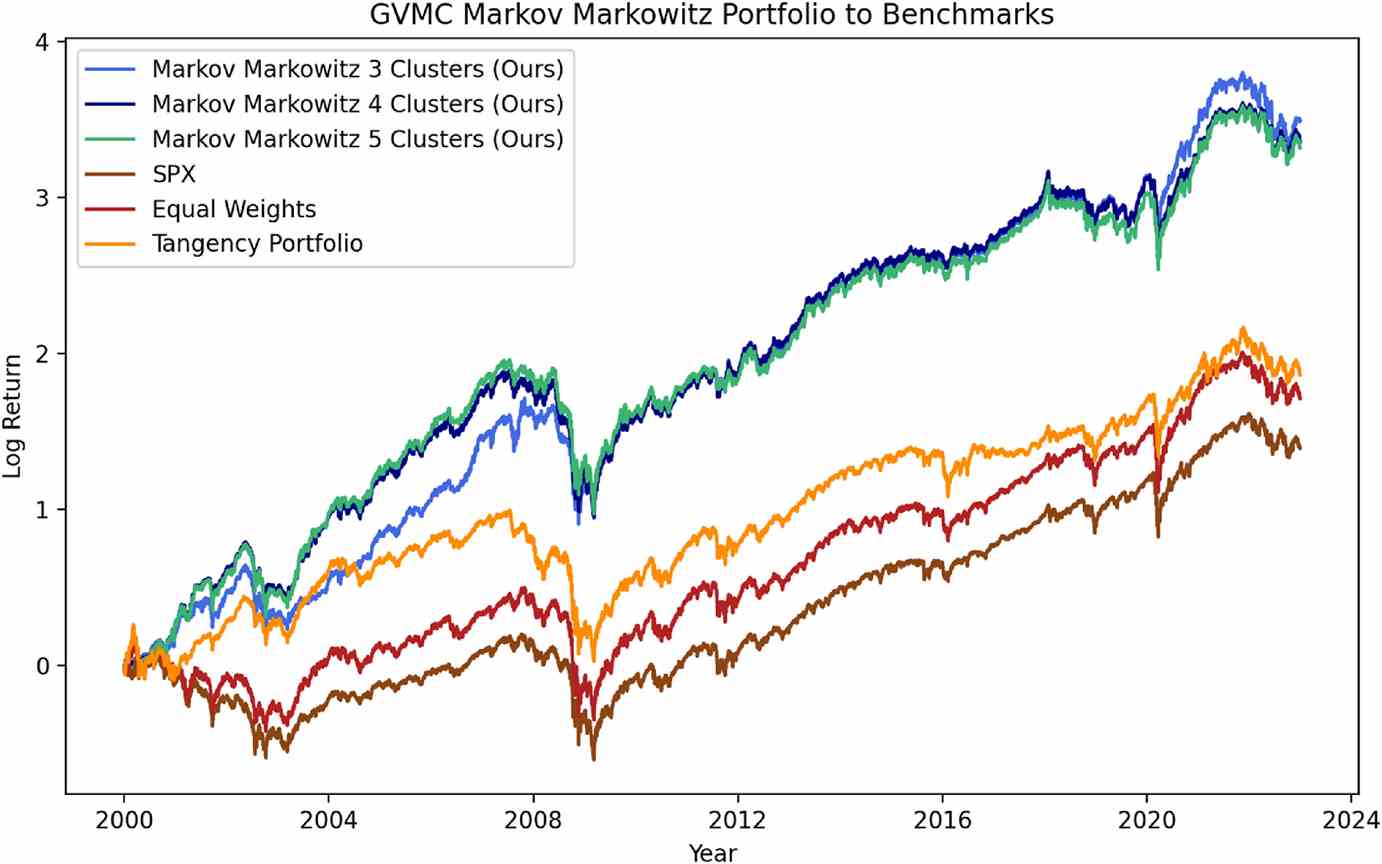
In a study published in The Journal of Finance and Data Science, a team of researchers in the US developed a novel method to model market regime dynamics and construct portfolios with significant out-of-sample performance compared to benchmarks (Figure 1).

“To define the market states, we used efficient frontiers, which are tradeoff curves constructed when optimizing portfolios that maximize expected return and minimize volatility,” explained the first and corresponding author of the study, Nolan Alexander. “These efficient frontiers can be decomposed to their functional form, which is defined by three coefficients.”
These states then followed a Markov process—a model where the probability of transitioning to one state given the current state is the historical proportion of that same transition.
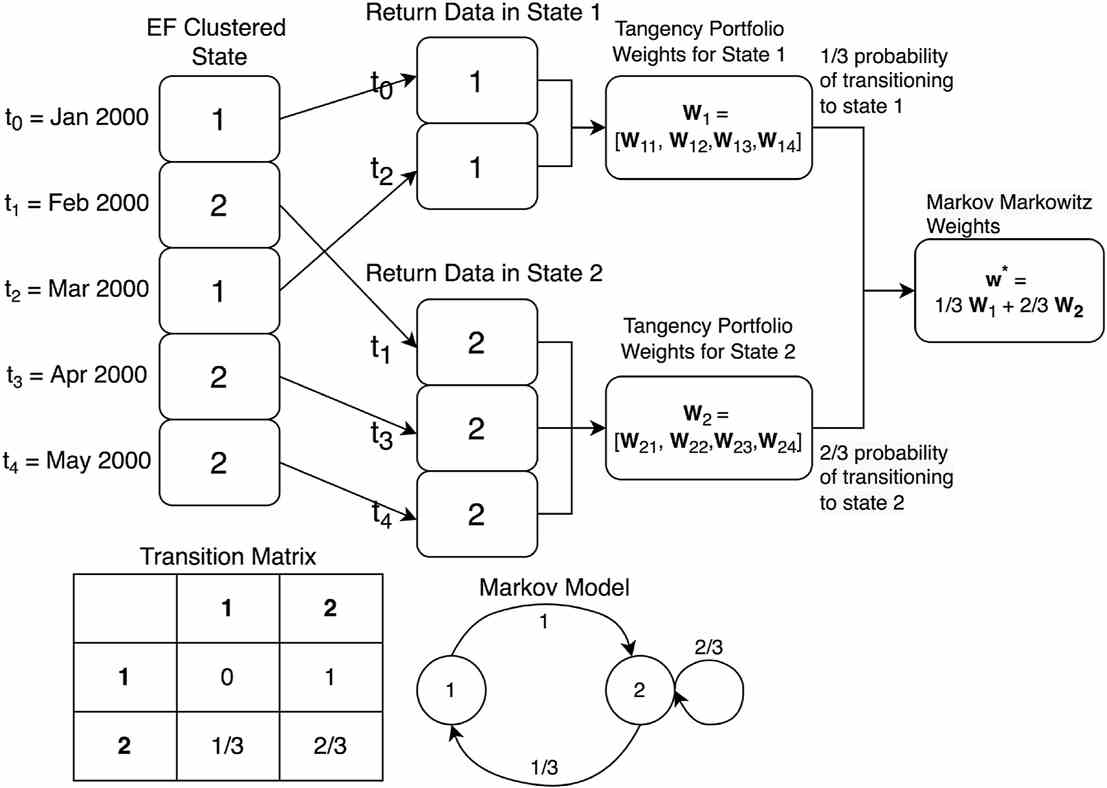
“To develop a portfolio using this Markov model, we computed portfolio-optimized weights for each state that are each calculated using only data in that state,” said Alexander. “Then, the weights are aggregately weighted by the probability of transitioning to each state.”
A simplified example of this method is shown in Figure 2.

“The proposed model is more interpretable than standard regime shifting Hidden Markov Models (HMM),” added Alexander. “A significant limitation with HMMs is the lack of interpretability due to the states being hidden.”
As the team’s proposed model uses observable states, observing intermediate components of the model to better understand how it determines the final weights is now possible.
“We found that among each of the universes, there exist multiple bull market states, with one significantly more likely to transition to a bear market than the others,” shared Alexander. “Additionally, we found that the universes that partition the US stock market, when in the bearish state, are more likely to recur than transition to any other state. However, this recurrence property does not hold for the Developed Markets universe.”
Contact author name, affiliation, email address: Nolan Alexander, University of Virginia, nka5we@virginia.edu
Conflict of interest: The authors do not have any competing interests
See the article: Nolan Alexander, William Scherer, Jamey Thompson. Asset Allocation Using a Markov Process of Clustered Efficient Frontier Coefficients States. The Journal of Finance and Data Science, 2023. https://doi.org/10.1016/j.jfds.2023.100110

